|
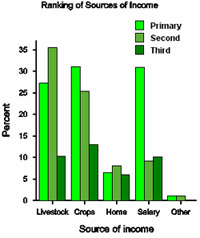
Statistical modelling/Comparison of sources of income The bar chart produced earlier (and repeated below) showed that crops were most frequently ranked first. Livestock, however, followed closely and were ranked second more often than crops. A combination of the index information and ranking information provides a good overall picture.
|
|||||||||||||||||||||
![]()
![]()
![]()